
Data visualization ek aisa process hai jisme hum data ko graphical ya pictorial format mein represent karte hain. Iska primary purpose hota hai complex aur vast data ko is tarah se dikhana ki wo aasani se samajh mein aa sake. Jab hum raw data ko directly dekhte hain, to usme se patterns, trends, aur insights nikalna mushkil hota hai. Lekin jab wahi data visually present hota hai, to hum usse easily comprehend kar sakte hain.
Sabse pehla benefit hai ki data visualization se data ko jaldi aur effectively communicate karna possible ho jata hai. Agar aap kisi business meeting mein ho aur aapko apne sales numbers present karne hain, to aap ek table ke through bhi yeh kar sakte ho, lekin agar aap usi data ko ek bar chart ya line graph mein dikhaoge, to aapke colleagues aur seniors usse jaldi samajh payenge. Aap trends, fluctuations, aur overall performance ko asani se highlight kar sakte ho.
Doosra major benefit yeh hai ki data visualization complex information ko simplify karta hai. Jab data visual form mein hota hai, to hum patterns aur relationships ko dekh kar samajh sakte hain. Jaise, agar aapko yeh dekhna hai ki sales aur marketing expenses ke beech kya relationship hai, to aap ek scatter plot ya bubble chart use kar sakte ho. Yeh chart turant aapko batayega ki jab marketing expenses badhe, tab sales mein kya farak pada.
Data visualization ka basic purpose yeh hai ki raw data ko visually represent kiya jaye. Iska matlab hai ki hum numbers aur text ko aise graphs, charts, aur diagrams ke form mein present karte hain, jisse complicated information ko samajhna asaan ho jaata hai. Iski madad se hum patterns, trends, aur outliers easily identify kar sakte hain, jo otherwise difficult hota hai jab hum data ko tables ya spreadsheets mein dekhte hain.
Data visualization ka sabse bada benefit yeh hai ki yeh data ko easily understandable bana deta hai. Jab aap koi report ya analysis dekhte ho jisme graphs aur charts hote hain, to aap jaldi se data ke conclusions tak pahunch sakte ho.
Types of Data Visualization
Data visualization ke kaafi types hote hain, like:
Bar Charts: Yeh commonly used type hai jisme different categories ko bars ke through represent kiya jata hai. Yeh comparative analysis ke liye best hote hain.
Line Charts: Time series data ko represent karne ke liye use kiya jata hai. Agar aapko kisi cheez ka trend dekhna hai over time, to line chart use karna best rahega.
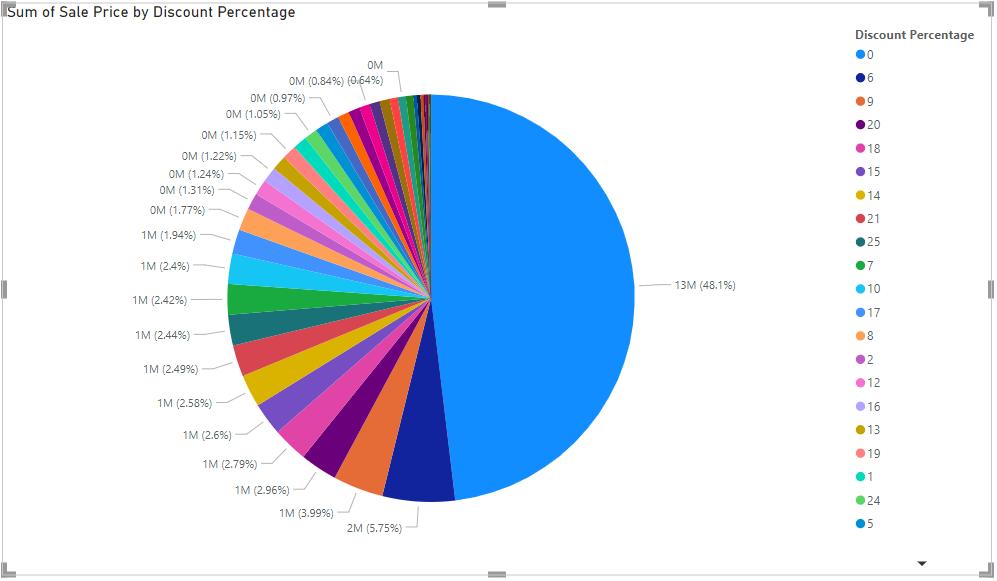
Pie Charts: Yeh circular chart hota hai jo data ko proportions mein dikhata hai. Agar aapko yeh dikhana hai ki total ka kitna percent ek specific category mein hai, to pie chart ka use hota hai.
Scatter Plots: Yeh chart data ke do variables ke beech relationship ko dikhata hai. Agar aapko correlation ya trend analysis karna hai, to scatter plot useful hota hai.
Aaj ke digital era mein, jahan har din vast amount of data generate ho raha hai, wahan data visualization ki importance aur bhi badh gayi hai. Organizations apne decision-making process ko enhance karne ke liye data visualization tools ka use kar rahe hain. Yeh tools na sirf data ko visually present karte hain, balki usko interactive bhi banate hain, jisse users apne hisaab se data ko explore kar sakte hain.
Data visualization se insights nikalna asaan hota hai, jo ki business strategy, product development, marketing campaigns, aur customer satisfaction ke liye crucial hote hain. Jab aap apne data ko effectively visualize karte hain, to aap better decisions le sakte hain, apne target audience ko accurately target kar sakte hain, aur market trends ko samajh kar apni strategies ko align kar sakte hain.
Aaj ke time mein, sirf static charts se kaam nahi chalta. Interactive data visualizations zyada popular ho rahe hain jisme users apne hisaab se data ko explore kar sakte hain. Jaise dashboards, jisme filters aur drill-down options hote hain, taaki users alag-alag dimensions se data ko explore kar sakein. Tools jaise Tableau, Power BI, aur Google Data Studio aise interactive visualizations ke liye bahut useful hain.
Aaj market mein kai powerful tools available hain jo data visualization ke process ko easy banate hain. Yeh tools user-friendly hote hain aur inhe koi bhi technical knowledge ke bina use kar sakta hai:
Data visualization tabhi effective hoti hai jab usko best practices ko dhyan mein rakh kar banaya jaye. Kuch important tips hain: